Our goal is simple: position patent documents on a graph in two-dimensional space that represents their meaning (or semantic content) relative to other patents. This permits us to easily see clustering, gaps and frontiers in technological space.
Since the entire text within each patent document is far too long and technical to be processed manually, we leverage machine learning to perform that analysis instead. From the computational science field of natural language processing we use word embeddings, vector representations of words that can capture meanings in numeric ways. These representations can then provide direct comparisons of the semantic relationships between individual words, and more importantly for the current application, between full documents. Word embeddings are obtained from large corpora of plaintext data by finding patterns in existing written language, and then extracting those patterns in a compressed way as numeric semantic features. There are many common ways to perform this type of feature extraction including latent semantic analysis (Deerwester et al., 1990), neural-probabilistic language models (Bengio et al., 2003), deep learning models (Collobert and Weston, 2008), and the skip-gram algorithm with negative sampling algorithm (Mikolov et al., 2013). Since the skip-gram model has been shown to have state-of-the-art performance on a number of prominent natural language processing tasks, we use it for the work that follows here.
Method
The model uses artificial neural networks to try to predict individual word context, which consists of the words surrounding each single word in a document. As the model sees more training text, it gradually adjusts its parameters so that the error is minimized when performing the context prediction. Once training is complete, the network is presented with a single word and the resulting internal activations of the network are used as that word’s semantic embedding vector.
For the purposes of this work, we use word embeddings directly with the text of patent documents to generate full document embeddings that lie in the same semantic space as the words themselves. These document embeddings can be formed in various simple ways including averaging or summing the word embedding vectors of the words contained within the document. Once document embeddings are obtained, then we can reason about the relationships between documents in computational ways.
Given the semantic document vector for each patent under consideration, we can project them into two-dimensional space for easier visualization. We use a t-distributed Stochastic Neighbor Embedding (t-SNE) projection algorithm to maintain the relative semantic distances between document vectors.
Usage
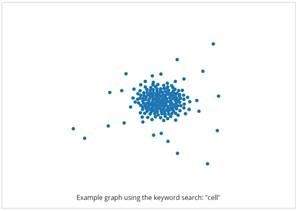
Our submission is an interactive, online application as a prototype project. It is available freely to all visitors at http://cs.coloradocollege.edu/~mwhitehead/CancerMoonshot/, where users may enter a keyword to query the patent database to create a custom visualization. The resulting graphs are provocative in several key aspects, helping us to ask (and answer) important questions. Any keyword will bring up all patents using that text in the patent title, and clicking on any dot in the resulting graph will show the patent number and title (which are hyperlinked to the front-page material of that patent.
Due to the time constraint in building this prototype, the current application is limited to only single keywords (although in theory, strings of keywords are possible and simply require more computational power than our current server can provide). We elected to limit the keyword search to only patent titles, again in the interest of simplicity and processing speed, but the use of keywords from complete-text documents is simply more time-consuming and slow to process. Finally, in the interests of interactivity, this prototype queries and displays only those U.S. patent documents from the Cancer Moonshot dataset granted in the period between January 5, 2010 and March 17, 2015 but again this is only a limitation chosen to speed up data access and processing.
Results
Several examples, along with the keywords that generated them, are presented in the attached file.
Notice first that these graphs suggest visually-proximate patents that might serve similar purposes or share similar themes. Often those neighbors will be obvious but this analysis opens up the possibility of discovering hidden proximities of real value. If this patented process did not succeed, but I need something very similar, where might I search for the next solution? This graphing technique has suggestions to guide the search for neighboring technologies or techniques, either to secure against litigation or infringement concerns, or to find alternative/substitute approaches to similar issues.
Second, the graphs provide a projected outline of the documents under consideration, drawing our attention toward the edges, toward the holes, or toward the clusters. Where might translational scientists or funding foundations find the most creative patents, the ones with the greatest distance to other patents? Where might they find the edges of the discipline, the opportunity for advancement without competitors or previous knowledge? How might we extend our knowledge by pushing the edges of the graph outward? Where should we focus our energies on backfilling gaps in our research knowledge?
We look forward to exploring these answers together with researchers, policymakers, funding agents and the general public.
When you click on any of the above links within the Tableau visualization you will be leaving the United States Patent and Trademark Office (USPTO) Open Data Portal. The USPTO does not necessarily endorse the views expressed or the facts presented on this site. Further, the USPTO does not endorse any commercial products that may be advertised or available on this site. You may wish to review the privacy notice on those sites since their information collection practices may differ from ours.