A Tableau Public vizualization solution “Patents Statanalyzer” is being presented to get a better understanding of the trends/patterns in the PTO Cancer Moonshot dataset released as part of the challenge.gov challenge. More advanced solutions can be built using these plots as starting point and develop dashboards for more exhaustive what-if analysis.
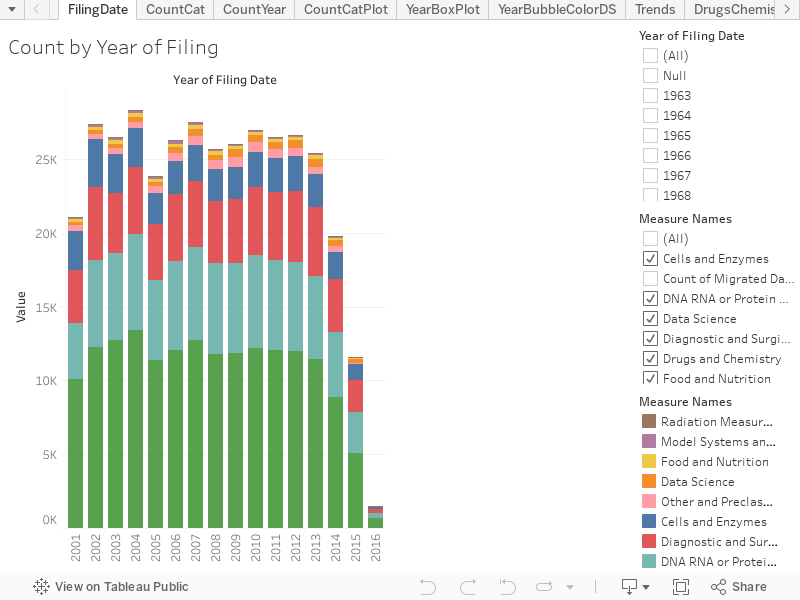
All the viz are interactive in nature. Filters have been provided so the parameters can be modified for the viz to focus on certain sections of the data. Hovering over the charts will give more detail than has been provided in the screenshots above. Additional fields can be added for the hover information as well as included in filters and most important, also in the charts developed. There is a tremendous amount that can be done with the existing viz – lot more can be added for insight and investigation purposes.
Please click here to download the user guide: download
When you click on any of the above links within the Tableau visualization you will be leaving the United States Patent and Trademark Office (USPTO) Open Data Portal. The USPTO does not necessarily endorse the views expressed or the facts presented on this site. Further, the USPTO does not endorse any commercial products that may be advertised or available on this site. You may wish to review the privacy notice on those sites since their information collection practices may differ from ours.