In the fight against cancer, data analytics has been, and will continue to be, key in developing new treatments, understanding treatment efficacy, and identify gaps in current treatment methodologies. The proposed solution presented here will help visualize the USPTO cancer related patent information, which will enable decision makers identify trends in patent applications, potentially influencing regulation to incentivize investments in critical areas.
The proposed solution had 3 main guiding principles:
- Flexible – the solution needs to be flexible enough so users will be able to align visualizations to the question they are looking to answer, with minimal technical know-how. Visualizations need to be adjustable so that users could change between variables based on the question at hand.
- Intuitive – the solution will require users to create their own filters and visualizations (if users require something other than the pre-set visualizations), but will not require users to spend a significant amount of time on understanding how it works or how to change visualization settings.
- Detail oriented – the solution will include simple summary visualizations which are backed up by a large dataset, which can be automatically refreshed. Details could also be identified by applying, or removing, certain filters.
Based on the above, we recommend a solution that will be based on Spotfire® – a cloud visualization software that is publicly available and has multiple uses in pharmaceutical research and trend analysis and visualization.
The Spotfire® dashboard that was created includes several screens –
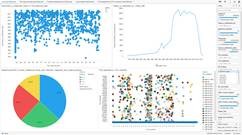
- Main screen – the main screen will include pre-set visualizations that will provide information on 1) time from patent grant to FDA approval, 2) number of filed patents by year, 3) percentage of filed patents by category, and 4) clutter plot showing ingredients by treatment types and manufactures.
- Users can then filter results by filters such as active ingredient, filling date, manufacturer, CPC / IPC / USPC, type of application, NIH grant, FDA trade name, and many more.
- A change to the above filters will change all visualizations on the main screen, but will not impact the sub-screens.
- Sub-screens – each one of the four sub-screens includes a deep-dive into one of the visualizations on the main screen, enabling users to analyze information in more detail.
So what’s next?
Using this database and tool has its benefits, but it will be limited if used in a silo, without incorporating other data sources and / or developing additional visualizations. For example, matching patient level data with treatments stemming from patents in the cancer disease area would allow analysis around the connection of patent types, time from filling to approval and potentially manufacturer to co-pay amounts and patient longevity. In direct connection with the USPTO, this could provide insights into how the USPTO decisions on patents could impact patient’s quality of life and long-term healthcare costs. Furthermore, linking this dataset with FDA label information for approved drugs will provide additional insight into the correlation between cancer indications and their respective patent applications life-cycle.
We’ve spent a lot of time developing this dashboard, and know it could provide many valuable insights to those who spend time looking at the possibilities it provides in data analytics. However, we are also cognizant of the fact that this is only a first step in visualizing and deriving valuable insights into the disease area that touches, and is touched by, many.
We are happy to answer any questions that might arise, and value your feedback.
Please click here to download the user guide: download
* Spotfire® is a registered trademark of TIBCO Software Inc. The authors of this proposal are not affiliated with Spotfire® or TIBCO Software Inc.
When you click on any of the above links within the Tableau visualization you will be leaving the United States Patent and Trademark Office (USPTO) Open Data Portal. The USPTO does not necessarily endorse the views expressed or the facts presented on this site. Further, the USPTO does not endorse any commercial products that may be advertised or available on this site. You may wish to review the privacy notice on those sites since their information collection practices may differ from ours.