These Cancer Moonshot visualizations of the patent data set should assist NIH and NCI decision makers when they make funding decisions for future cancer research.
NIH and NCI have data regarding the research activities of NIH grant recipient organizations, but may lack data regarding research from other organizations that are not receiving NIH grants. Patents are filed on research and product development, and analyzing patent data sets may enable NIH/NCI researchers to make better funding decisions in the future.
Tableau Public was utilized to visualize the patent data set. Several pages were created, with each page having multiple related visualizations to help researchers understand research trends from the data set.
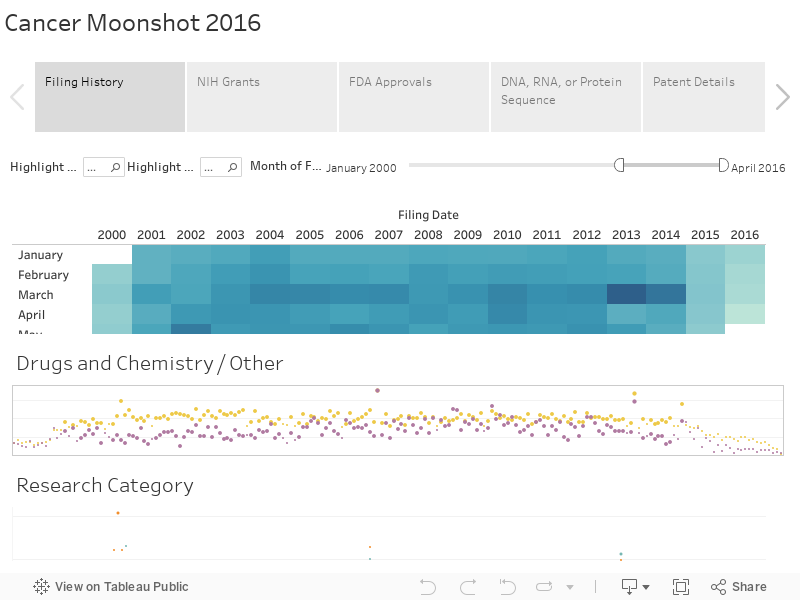
The “Filing History” page displays an overall view of the contents of the data set. Month and Year for Filing Data is shown in a color scheme, with darker colors representing a larger amount of patent applications filed that month. Moving the cursor over the relevant cell shows the number of applications filed in the relevant month and year.
The second graph on the “Filing History” page dives into the details of the categorizations of the patents in the data set, and shares the insight that the most often cited category for a patent is “Drugs and Chemistry.” The graph shows the number of patent applications that were categorized as related to the #1 category by quantity, “Drugs and Chemistry” versus the #2 classification category (“other”). The third graph shows the remaining categories with smaller quantities of patent filings in the data set (“cells and enzymes,” “diagnostics”, etc.).
In addition to being able to rank the categories to see how much research is going on in each area over time, several outliers in the data set are immediately visible from the visualizations on the “Filing History” page. Patent filings in March 2013, March 2014, October 2007, and a few others were higher than most other results. Unfortunately, these increases in the quantity of patent filings were the results of regulatory activity (America Invents Act regulations in 2013/2014, USPTO rules in 2007, etc.), so the outliers aren’t relevant for NIH/NCI decision makers. Another outlier is the reduced quantity of applications filed in 2015 and 2016; however this is related to the 18 month delay before publication of patent applications, which results in many patent applications filed in 2015 and 2016 not being present in the data set.
The “NIH Grants” page displays patent applications filed by NIH Grant Receiving organizations over time. Several trend lines show projections of future patent applications by these organizations. Similar to the previous page, data from 2015-2016 is incomplete and doesn’t include yet to be published applications with filing dates in 2015-2016. From the second graph, we can see immediately that “Drugs and Chemistry” patent application filings are more common from these organizations than any other type of patent application, followed by “Cells and Enzymes” patent applications.
The “FDA Approval” page displays patents approved by the FDA over time. Since FDA approval requires a separate approval process with additional delays, the last few years of data are incomplete since FDA approvals will happen in the future for applications that have been filed recently. The largest category of FDA approved patents is for “Drugs and Chemistry”.
The “DNA, RNA or Protein Sequence” page shows further analysis on patent applications that were categorized as containing “DNA, RNA, or Protein Sequence” information. These patent applications are particularly important for cancer research related to personalized medicine. The first graph shows two lines with the larger quantity line being the number of patent applications that were filed by NIH grant receiving organizations and the smaller quantity being the number of patent applications that were approved by the FDA. This graph highlights the difference between the number of patent applications funded by NIH/NCI, and the even smaller number of patents that are eventually approved by the FDA. The visualizations on the bottom of the page show the number of patent applications containing DNA, RNA, or protein sequence” categorized by the organizations that filed the patent applications, with the left side diagram focusing on the NIH grant receiving organization and the right side diagram focusing on patent applications that received FDA approval.
The last two pages, the “Patent Details” page and the “FDA Details” page, show table views of the data related to FDA applicants. The first column on both pages is the FDA applicant name, the patent details page then displays patent details for the particular FDA applicant, the FDA details page then displays FDA ingredient and other FDA information for the particular FDA applicant.
Reviewing these visualizations enables NIH decision makers to gain a better understanding of where cancer research is currently going on. Furthermore, one of the specific insights that can be spotted is that although “Drugs and Chemistry” was the #1 category for the overall patent data set, NIH funded patents, and FDA approved patents, the other categories varied significantly in their ranking, implying that the overall industry, NIH, and FDA pursued different priorities in choosing patent filings to approve and fund.
Future work could combine this data set with additional patent materials from the patent developer’s website, articles on cancer research from PubMed, and information on cancer and gene names from the Cancer Genome Atlas. For example, analysis could focus analysis could focus on the linkage between patent applications and PubMed articles that are listed as references on a patent. Further analysis could focus on links between patent inventors and PubMed authors. Personalized medicine could leverage the Cancer Genome Atlas to build a list of cancer and genome key words, and then search on the key word list through the full text of the patents in the data set.
In conclusion, visualizing patent data can be of significant help in understanding where cancer research is currently going on, where FDA approval has been obtained, and where there is a future need for increased funding by NIH and NCI.
When you click on any of the above links within the Tableau visualization you will be leaving the United States Patent and Trademark Office (USPTO) Open Data Portal. The USPTO does not necessarily endorse the views expressed or the facts presented on this site. Further, the USPTO does not endorse any commercial products that may be advertised or available on this site. You may wish to review the privacy notice on those sites since their information collection practices may differ from ours.